2009-09-01
deviance explained[stat][r]
GLMではR^2の代わりに,deviance explainedが使われることが多いようだ.簡単な関数だが,glmの結果からdeviance explainedを計算する関数は以下のとおり.
# deviance explained: 1 - [Residual Deviance] / [Null Deviance]
dev.exp <- function(x){ # xはglmの結果
list("Deviance explained" = 1 - x$deviance / x$null.deviance,
"Null Deviance" = x$null.deviance,
"Residual Deviance" = x$deviance)
}
2009-04-12
zero-inflated poisson model[r][stat]
鳥居稔さんのお試しポアソン回帰(特に61頁以降)を参考にして,簡単なzero-inflated poisson modelの解析をしてみる.以下はRのコード.
今回やりたいカヤランの解析も基本的には同じようなデータ構造なので,これと同じようにやってみよう.これで,ようやくカヤラン論文の修正の目処がついた.結局,WinBUGSとR2WinBUGS([2009-04-10])は使わず.
# # 準備(rmutilとgnlmのインストール)
# http://popgen.unimaas.nl/~jlindsey/rcode.htmlから以下のファイルを入手して,インストールする
# http://popgen.unimaas.nl/~jlindsey/rcode/rmutil.zip
# http://popgen.unimaas.nl/~jlindsey/rcode/gnlm.zip
dist <-rnorm(1000)
poi <-rpois(1000, exp(1.5 +0.8 * dist))
table(poi) # データの確認(結果は省略)
mean(poi) # 平均値
# [1] 6.369
var(poi) # 分散
# [1] 52.48132
# 0過剰(zero-inflated)にする
inf.poi <- poi # 基本はポワソン分布
inf <- rbinom(1000, 1, 0.7) # 7:3の2項分布を発生
table(inf) # データを確認(結果は省略)
# inf
# 0 1
# 286 714
inf.poi[inf==0] <- 0 # infが0のところはポワソン分布のデータを0にして0を過剰にする
table(inf.poi) # データの分布を確認
mean(inf.poi) # 平均値が変化している
# [1] 4.322
var(inf.poi) # 分散が変化している
# [1] 35.54386
library(rmutil)
library(gnlm)
# # # # # # # # # # # # # # # # # # # # # # # # # # # # # # # # # # # # # # # # # # #
gnlr(inf.poi, distribution="Poisson", mu=~exp(b0+b1*dist), pmu=c(b0=1,b1=0))
# Call:
# gnlr(inf.poi, distribution = "Poisson", mu = ~exp(b0 + b1 * dist),
# pmu = c(b0 = 1, b1 = 0))
#
# Poisson distribution
#
# Response: inf.poi
#
# Log likelihood function:
# {
# m <- mu1(p)
# -sum(wt * (-m + y * log(m)))
# }
#
# Location function:
# ~exp(b0 + b1 * dist)
#
# -Log likelihood 3127.206
# Degrees of freedom 998
# AIC 3129.206
# Iterations 10
#
# Location parameters:
# estimate se
# b0 1.2021 0.01851
# b1 0.6916 0.01402
#
# Correlations:
# 1 2
# 1 1.00 -0.57
# 2 -0.57 1.00
# # # # # # # # # # # # # # # # # # # # # # # # # # # # # # # # # # # # # # # # # # #
fmr(inf.poi, distribution="Poisson", mu=~exp(b0+b1*dist), pmu=c(b0=1,b1=0), pmix=0)
#
# Call:
# fmr(inf.poi, distribution = "Poisson", mu = ~exp(b0 + b1 * dist),
# pmu = c(b0 = 1, b1 = 0), pmix = 0)
#
# Poisson distribution
#
# Response: inf.poi
#
# Log likelihood function:
# {
# m <- mu1(p)
# s <- mixt(p)
# -sum(wt * log((1 - s) * cens + s * dpois(y, m)))
# }
#
# Location function:
# ~exp(b0 + b1 * dist)
#
# Mixture function:
# exp(p[1])/(1 + exp(p[1])) * rep(1, n)
#
# -Log likelihood 2000.778
# Degrees of freedom 997
# AIC 2003.778
# Iterations 13
#
# Location parameters:
# estimate se
# b0 1.498 0.01993
# b1 0.801 0.01564
#
# Mixture parameters:
# estimate se
# p[1] 0.9546 0.07613
#
# Correlations:
# 1 2 3
# 1 1.0000 -0.6295 -0.1118
# 2 -0.6295 1.0000 0.1010
# 3 -0.1118 0.1010 1.0000
# Warning message:
# NA/Inf は正の最大値で置き換えられました
# # # # # # # # # # # # # # # # # # # # # # # # # # # # # # # # # # # # # # # # # # #
# pに影響を及ぼす変数を組みこむ場合
# fmr(inf.poi, distribution="Poisson", mu=~exp(b0+b1*dist), pmu=c(b0=1,b1=0), mix=~b2+b3*dist, pmix=c(b2=0,b3=1))
2009-04-10
WinBUGSとR2WinBUGS[stat][tool]
カヤラン論文関連で,zero-inflated poisson model(ZIP model)を使うため,WinBUGSを使うことにした.そのためには,ZIP modelとWinBUGS(とR2WinBUGS)の使い方を勉強しなければならない.インストールしてとりあえず動かせる状態にはなった.
The BUGS ProjectからWinBUGS14.exeを入手・実行.
RのメニューでR2WinBUGSを実行.
生態学データ解析のR2WinBUGS をとりあえず動かす (Windows user むけ)のコードで,bugs.directoryを変更して実行してみる.これで,とりあえずサンプルは動いた.
飯島の雑記帳の研究ソフト/R2WinBUGSなどを参考にしながら,使い方を勉強しよう.
library(R2WinBUGS) # R2WinBUGS のよみこみ
example(bugs) # モデルファイルやパラメーター・データが準備される
schools.sim <- bugs(
data, inits, parameters, model.file,
n.chains = 3, n.iter = 5000,
bugs.directory = "d:/pf/WinBUGS14/",
working.directory = NULL,
clearWD = TRUE,
debug = TRUE # これは FALSE でも動作する
)
print(schools.sim) # bugs オブジェクトのまとめ
plot(schools.sim) # bugs オブジェクトの作図
2009-04-03
三群の平均値(代表値)の差の検定[stat][r]
[2009-02-28]と[2009-03-26]に書いた二群の平均値(代表値)の差の検定に関連して,三群の平均値(代表値)の差を検定するときというのがある.結論としては,母分散の異なる可能性がある場合は,予備検定なしで等分散性を仮定しない一元配置分散分析を行うのが良いらしい.Rでは以下のようにする.
oneway.test(extra ~ group, data = sleep) # 等分散を仮定しない場合(デフォルト)
oneway.test(extra ~ group, data = sleep, var.equal = TRUE) # 等分散を仮定する場合
参考:一元配置分散分析
2009-03-26
等分散を仮定しないt検定[r][stat]
[2009-02-28]に書いた等分散を仮定しないt検定をするには,Rでは関数t.test()を使う.デフォルトでは,var.equal=Fになっているので,そのまま使う.逆に,等分散を仮定する場合は,var.equal=Tを指定する.
# 書式
# t.test(group1, group2, var.equal=F)
# 等分散を仮定しない
t.test(1:10, 7:20, var.equal=F)
t.test(1:10, c(7:20, 200), var.equal=F)
# 等分散を仮定する
t.test(1:10, 7:20, var.equal=T)
t.test(1:10, c(7:20, 200), var.equal=T)
2009-02-28
二群の平均値(代表値)の差の検定[stat]
今まで,自分自身やたらとマン・ホイットニーのU検定を使っていたけど,それはあまり良くないらしい.まずは,二群のサンプルサイズをできるだけ揃えるようにすべきで,二群の分散が等しくない場合は,等分散を仮定しないt検定をするのが良いとのこと.また,三群以上の平均値の差の検定で分散が異なる場合には,予備検定なしで等分散性を仮定しない一元配置分散分析が良いらしい.
2008-05-23
生態学関係のパッケージ(Environmetrics)[r][stat]
[2006-08-22]に書いていたけど忘れていたので再度メモ.生態学関係のパッケージを一括してインストールするにはEnvironmetricsが良い.
参考
2008-05-07
reshape[stat][r]
Rでまず修得すべき技能は何か?の中で解説されているreshape(data.frame)という関数で,データフレームの形式変換が出来るようだ.as.data.frame.tableという関数と似ているが,使い方はちょっとちがうみたい.
2008-03-30
ベイズ[2008生態学会][stat]
ベイズ統計学を勉強したい.したいだけではだめなので,勉強して自分のデータに摘要してみるのが一番だろう.まずは,そのための勉強だ.
2008-02-05
クラスカル・ウォリスとシェッフェ[stat]
[2007-12-22]に書いたクラスカル・ウォリス検定の次に多重比較をするのは,シェッフェの方法ではなくて,クラスカル・ウォリスをベースにしたシェッフェタイプの検定らしい.
統計学関連なんでもありで「シェッフェタイプ」と検索すると出てくる.ただし,最大保持記事数は6000でこれを超えると古いものから削除されるらしいので,時間が経っていたら出てこないかも.
2007-12-22
多重比較[stat][r]
少し前に,多重比較について共同研究者とやり取りをした中で勉強した.そのときに参考にした頁.
2007-12-04
クラスター分析[stat][r][book]
生物群集の多変量解析の生物群集の分類(クラスター分析)をRで実行する方法(方法は71頁から,調査資料は12頁の表1・2).
library(cluster) # ライブラリの呼び出し
mat <- t(matrix(c(29,12,2, 9,26,5, 12,21,1, 15,15,10, 3,16,34, 9,4,18), ncol=6)) # 調査資料
cls <- agnes(mat) # 非加重平均法(UPGMA)
plot(cls) # 結果の図示
2007-09-28
複数の群間の検定[stat][r]
複数の群間の検定の覚書.
いくつかの群に分かれた資料の母平均に差があるかを検定するのには,一元配置の分散分析を使用する.母代表値(中央値?)に差があるかを検定するには,クラスカル-ウォリス検定を使用する.また,多重比較にはシェッフェの方法による対比較を使用する.
oneway.test(data, group) # http://aoki2.si.gunma-u.ac.jp/lecture/Average/oneway-ANOVA-r.html
kruskal.test(data, group) # http://aoki2.si.gunma-u.ac.jp/lecture/Average/kwtest-r.html
kruskal.wallis(data, group) # http://aoki2.si.gunma-u.ac.jp/R/kruskal-wallis.html
2007-07-06
回帰分析の結果を要約する関数[r][stat]
回帰分析の結果をsummary以上に要約する関数.
abs.lm <- function(x){
if(!class(x)=="lm" & !class(x)=="summary.lm") { # lmかsummary.lmかの確認
paste(x, "はlmでもsummary.lmでもありません", sep="")
} else {
if(class(x)=="lm") x <- summary(x) # lmをsummary.lmに変換
coef <- x$coefficients[,c(1,4)] # 推定値と有意水準
coef[,2] <- as.character(cut(coef[,2], breaks=c(0,0.001,0.01,0.05,1), # 有意水準を記号に変換
labels=c("***","**","*","n.s."),right=F))
coefficients <- data.frame(0) # 結果の入れ物を用意
for(i in 1:nrow(coef)){ # 行ごとに
coefficients <- cbind(coefficients, # 推定値と有意水準を結合
as.data.frame(paste(coef[i,1], coef[i,2], sep=" ")))
}
coefficients <- coefficients[-1] # 始めのデータを削除
colnames(coefficients) <- rownames(coef) # 列名を設定
coefficients <- cbind(coefficients, # 決定係数・データ数を追加
data.frame(r.squared=x$r.squared, adj.r.squared=x$adj.r.squared, n=length(x$residuals)))
coefficients
}
}
# 使用例
data(cars)
lm(cars$dist ~ cars$speed)
summary(lm(cars$dist ~ cars$speed))
abs.lm(lm(cars$dist ~ cars$speed))
2007-03-09
行列の資料を散布図に[stat][r]
[2007-02-24]と似たような関数で,散布図を描くものを作った.色は灰色で濃淡をつけるように設定している.
作ってから気づいたが,そういえばmatplotという関数があった.データの上書き用として,matpoints matlines という関数もあるようだ.
> ## 行列の資料を散布図にする
mat.plot <- function(mat, trans=FALSE, horiz=FALSE, type="b", ...){ # 行列
if(trans==TRUE) mat <- t(mat) # 行列を入れ替える
lim <- range(mat)
m <- ncol(mat) # 列数
n <- nrow(mat) # 行数
plot(1, type="n", axes=F, ann=F) # 何も描かない
j <- round(n*3); k <- round((j-n)/2) # 色の設定
col <- grey((j:0/j)[k:(k+n)]) # 色の設定
for(i in 1:n){ # 各行で
par(new=T)
if(horiz==TRUE){
plot(x=1:m, y=mat[i,], xlim=c(1,m), ylim=lim, col=col[i], type=type, ...) # 散布図
} else {
plot(y=1:m, x=mat[i,], ylim=c(1,m), xlim=lim, col=col[i], type=type, ...) # 散布図
}
}
}
## 使用方法
matplot(matrix(1:20, nrow=4))
mat.plot(matrix(1:20, nrow=4), trans=F, horiz=F)
mat.plot(matrix(1:20, nrow=4), trans=F, horiz=T)
2007-03-01
群ごとに生のデータ分布を描く[stat][r]
うまい!と言われる科学論文の書き方のp28,p30,p34に掲載されているグラフに似たものを描くための関数をRで作った.自分ではそれなりに満足のいくものを作ったつもりだった.あとは,boxplotとかで箱ひげ図を追加すればほぼ完成だ.
しかし,作ったすぐ後に,群馬大学の青木さんのR による統計処理に同じような関数(群別データ分布図)があるのをを知った.同じものと言うようよりも,もっとすばらしいものだ.事前に調べておけばよかった.
とはいえ,せっかく作ったので,公開.作ってみてよかったのは,mapply, lapply, sapply の使い方を勉強できた点.特に mapply は初めてちゃんと使った.
直接関係無いけど参考:グラフィックス事例集・条件プロット(coplot)
# 関数の定義
shift.plot <- function(df, cl=50, xmax=100,...){ # data.frame y軸の階級 x軸の幅
# 階級の区分
mn <- min(df[,1])
mx <- max(df[,1])
by=(mx-mn)/(cl-1) # 範囲/階級数
df <- cbind(df, cl=cut(df$n, seq(from=mn, to=mx+by, by=by), right=F))
df <- df[order(df[,2], df[,1]),]
# 近接した場合の移動量
freq <- na.omit(as.data.frame.table(tapply(df[,1], list(df[,3], df[,2]), length))) # 頻度
freq <- freq[order(freq[,2], freq[,1]),]
shift1 <- unlist(mapply(":", 1, freq[,3]))
df <- cbind(df, shift=shift1)
# 凡例別の移動量
shift2 <- xmax / (length(unique(freq[,2]))*2)
shift2 <- shift2 * seq(from=1, to=length(unique(freq[,2]))*2, by=2)
shift2 <- mapply(rep, shift2, tapply(df[,1], df[,2], length))
shift2 <- unlist(shift2[1:length(shift2)])
shift3 <- shift2 + xmax*0.01 # x軸の凡例の移動量 0.01を変更してズレを調整
# 移動量の合計
df$shift <- df$shift + shift2
plot(df$shift, df$n, xlim=c(0,xmax), xaxt="n", ...)
axis(side=1, at=unique(shift3), labels=as.character(unique(df[,2]))) # x軸を表示
}
# 使用方法
r <- 60
df <- data.frame(n=round(rnorm(r)*10,0), com=c(rep("a",r/2), rep("b",r/4), rep("c",r/4)))
shift.plot(df, cl=100, xmax=100)
2007-02-25
spatstat のいろいろな機能[stat][r]
忘れたときのためのメモ.密度分布・距離分布・最も近い点・透視図・解析の要約表示など.
参考:Journal of Statistical Softwareに掲載されたマニュアル.
library(spatstat) # ライブラリの呼び出し
data(cells) # データの呼び出し
# 密度分布図
par(mfrow=c(2,2)) # 2*2に分割
for(i in seq(from=0.07, to=0.08, by=0.01)){
Z <- density.ppp(cells, i) # 密度の推定
plot(Z, main = "Kernel smoothed intensity") # 密度分布
plot(cells, add = TRUE) # 散布図を追加
}
# 距離分布
Z <- distmap(cells, dimyx = 512)
plot(cells$window, main = "Distance map")
plot(Z, add = TRUE)
points(cells)
# 最も近い点を探す
plot(cells) # 散布図
m <- nnwhich(cells) # 最も近い点を探す
b <- cells[m] # 最も近い点との対応を作る
arrows(cells$x, cells$y, b$x, b$y, angle = 12, length = 0.1, col = "red") # 矢印で表示
# 透視図
persp(Z, colmap=terrain.colors(128), shade=0.3, phi=45, theta=30, main="perspective plot")
# 各種解析の要約表示
plot(allstats(cells)) # for unmarked point pattern
2007-02-25
指標付点過程(マーク付点過程:marked point pattern)[stat][r]
点過程のライブラリ spatstat の関数一覧.
マーク付点過程の解析方法を調べていたが,ネットで探してみると自分のRのページ紹介していたのがわかった.
# その他使えそうな関数の一覧
library(spatstat) # ライブラリの呼び出し
unmark # 指標を取り除く
setmarks # 指標を付ける
%mark% # 指標を付ける
cut # 指標の操作
split # 指標の操作
cut.ppp # 数値の指標を因子(factor)の指標に変換
split.ppp # 指標の因子ごとに分割
superimpose # 点過程を統合
nndist # nearest neighbour distance
pairdist # distance between each pair of points
Gcross # Multitype Nearest Neighbour Distance Function (i-to-j)
Gdot # Multitype Nearest Neighbour Distance Function (i-to-any)
Gest # Nearest Neighbour Distance Function G
Gmulti # Marked Nearest Neighbour Distance Function
Jcross # Multitype J Function(i-to-j)
Jdot # Multitype J Function(i-to-any)
Jest # Estimatethe J-function
Jmulti # Marked J Function
Kcross # Multitype K Function (Cross-type)
Kdot # Multitype K Function (i-to-any)
kest # K-function
Kmulti # Marked K-Function
2007-02-24
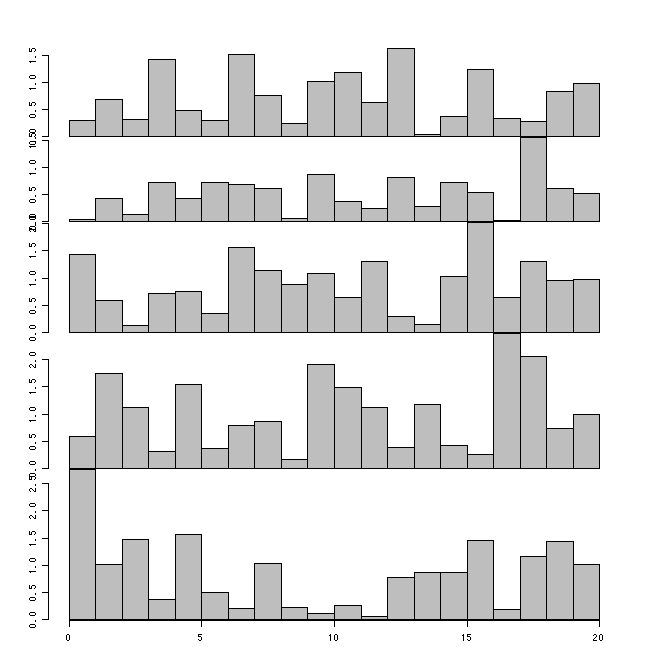
行列の資料をヒストグラムに[stat][r]
行列をヒストグラムみたいなもので,表現する関数(作図例).
## 行列資料で行ごとの数値をヒストグラム(もどき)で表示する
mat.hist <- function(mat, omi=rep(0.5, 4), mai=rep(0, 4), ratio=NA, ...){ # 行列と余白の設定
if(is.na(ratio)) ratio <- sapply(as.data.frame(t(mat)), max) # 各行の最大値(グラフの割合)
n <- nrow(mat) # 列数
layout(matrix(1:n, nrow=n), heights=ratio, TRUE) # 作図画面を分割
par(omi=omi) # 全体の余白
par(mai=mai) # 個々の余白
for(i in 1:n){ #
barplot(mat[i,], axes=FALSE, space=0, ...) # ヒストグラム(みたいなもの)
axis(side=2, ...) # 個々のグラフのy軸
}
axis(side=1) # 全体のx軸
}
# 使用例
m <- matrix(abs(rnorm(100)), ncol=20) # 乱数を発生
mat.hist(m) # 図示
2007-02-21
レズリー行列の計算例[stat][r]
必要があって,個体群生態学の基本を勉強している.『動物生態学』
## レズリー行列を作る関数
make.reslie <- function(recruit, survive){ # (recruit:齢別出生数 survive:齢別期間生存率)
i <- length(recruit)
reslie <- matrix(0, nrow=i, ncol=i) # 0行列
reslie[1,] <- recruit # 齢別出生数
for(j in 1:(i-1)){ # 齢別期間生存率
reslie[j+1, j] <- survive[j]
}
reslie
}
## レズリー行列と初期値から個体群の動態を計算する
pop.dynamic <- function(reslie, initial, n=20){ # reslie:レズリー行列 initial:初期値 n:世代数
i <- ncol(reslie)
pop.dyn <- initial # 1世代目
pop <- reslie %*% initial # 2世代目
pop.dyn <- cbind(pop.dyn, pop)
for(j in 3:n){
pop <- reslie %*% pop # 3世代目以降
pop.dyn <- cbind(pop.dyn, pop)
}
pop.dyn
}
## 個体群の動態を散布図にする
plot.dynamic <- function(dy){
n <- ncol(dy) # 世代数
m <- nrow(dy) # 齢数
plot(dy[1,], type="b", log="y", ylim=c(min(dy),max(dy[1,]))) # 最小齢の動態の散布図
for(i in 2:m){ # 各齢の動態の散布図
par(new=T)
plot(dy[i,], type="b", log="y", ylim=c(min(dy),max(dy[1,])))
}
}
## レズリー行列と初期値から平衡に達するまでの動態を計算する
pop.equil <- function(reslie, initial, n=5){ # reslie:レズリー行列 initial:初期値 n:平衡後の世代数
i <- ncol(reslie)
pop.dyn <- initial # 1世代目
pop <- reslie %*% initial # 2世代目
pop.dyn <- cbind(pop.dyn, pop)
j <- 2 # 第2世代から開始
ratio.befor <- round(pop.dyn[,j-1] / sum(pop.dyn[,j-1]), 5) # 第1世代の頻度分布
ratio.after <- round(pop.dyn[,j] / sum(pop.dyn[,j]), 5) # 第2に世代の頻度分布
while(sum(ratio.befor!=ratio.after)>0){
pop <- reslie %*% pop # 3世代目以降
pop.dyn <- cbind(pop.dyn, pop)
ratio.befor <- round(pop.dyn[,j] / sum(pop.dyn[,j]), 5)
ratio.after <- round(pop.dyn[,j+1] / sum(pop.dyn[,j+1]), 5)
j <- j + 1 # 次の世代へ
}
for(k in 1:n){ # 平衡後n世代を計算
pop <- reslie %*% pop # 3世代目以降
pop.dyn <- cbind(pop.dyn, pop)
}
list(dynamics=pop.dyn, ramda = sum(pop.dyn[,j+n])/sum(pop.dyn[,j+n-1]))
}
## 基礎情報の設定
recruit <- c(0, 2, 3, 4, 1) # 齢別出生数
survive <- c(0.4, 0.7, 0.7, 0.7, 0) # 齢別期間生存率
initial <- c(10, 2, 2, 2, 2) # 初期値
initial2 <- c(1, 5, 1, 1, 1) # 初期値
## 計算・作図
reslie <- make.reslie(recruit, survive) # レズリー行列
dy <- pop.dynamic(reslie, initial, 15) # 個体群動態を計算
par(mfrow=c(1,3))
plot.dynamic(dy) # 個体群の動態から散布図を作図
dy2 <- pop.dynamic(reslie, initial2, 15)
plot.dynamic(dy2)
dy3 <- pop.equil(reslie, initial, n=10) # 平衡に達するまでを計算
plot.dynamic(dy3$dyn)
dy3 # 平衡に達するまでの動態と固有値(λ)
2007-02-14
「比が同じ」か「差が同じ」か?[stat]
自分が普段扱っている資料は,差が同じかどうか?ということを気にかけているが,比が同じか?ということはあまり考えていない.時々は,考えてみる必要があるかも.馬車馬のように: [統計]比(割合)が一定と交互作用とを読んでそう思った.
2007-02-08
ヨンクヒール[stat][r]
先日,BIOMETRY:生物統計学メーリングリストの投稿でヨンクヒール(Jonckheere)の検定というのが書かれていた.クラスカル・ウォリス検定ににているが,多数のぐんのうちどれかが違うかというのではなくて,傾向性を検定するようだ.
参考:傾向検定
Rで実行:http://aoki2.si.gunma-u.ac.jp/R/Jonckheere.html
2007-01-15
入力間違いを見つける[stat][論文]
実際の調査資料で作業をしつつ、気づいた入力資料の確認方法。
1点目では、樹木の毎木調査で胸高直径と樹高を計測したとする。胸高直径と樹高とで個々にヒストグラムを作製した場合は、胸高直径が1000cmとか樹高が100cm(胸高直径を計測しているのに樹高が1.2mあるいは1.3m未満ということはありえない)とかいうような入力間違いは発見可能だ。しかし、胸高直径が5cmしかないのに樹高が15mもあるとか、胸高直径が30cmあるのに樹高が2mとかという間違いの可能性の高いものを見つけることはできない。それぞれ片方だけの値は通常の値の範囲に入るからだ。こういう極端な樹形の樹木が全く無いかと言えばそうではないが、間違いの可能性の高いデータを見つけることができるので、確認をしておいた方がいいだろう。
2点目では、樹種ごとに作図すれば低木であるはずの樹種の樹高が15mという入力間違いや、地点ごとに作図すれば二次林でそれほど太い樹木が無い地点で胸高直径が90cmという入力間違いを発見できる可能性がある。
参考項目:[2006-10-27]の入力間違いとそこからリンクしているデータの読み合わせ(九州大学の粕谷さんの「馬車馬のように」)
2007-01-14
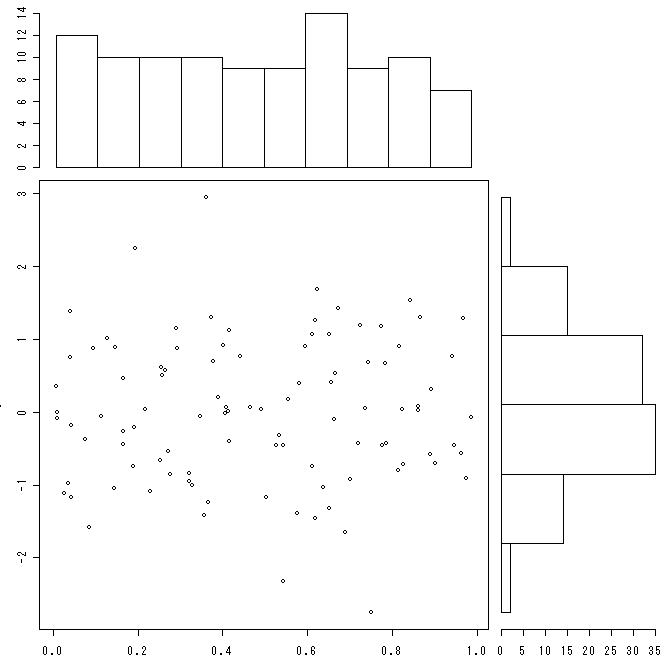
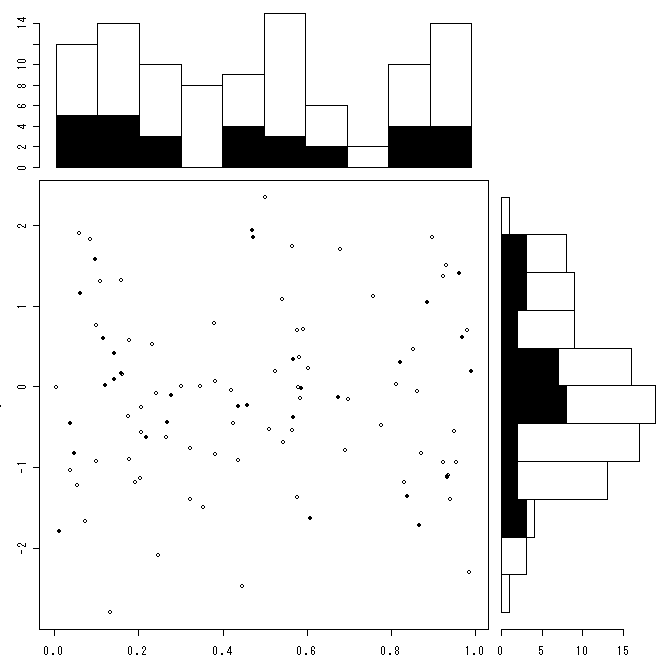
対応のある2変数のxy散布図とヒストグラムを描画[r][stat][hp]
RjpWikiのグラフィックス参考実例集を参考にして対応のある2変数のxy散布図とその横と上にヒストグラムを描画する関数を作った(作図例1)。さらに、そのうちの特定のものの散布図とヒストグラムを塗りつぶす関数を作った(作図例2)。
layout.plot.hist <- function(x,y, ratio1=c(3,1), ratio2=c(1,3)){
# (左下,左上,右下,右上)の順に(1,2,3,0) 0は描画しない 分割を縦横それぞれ設定
layout(matrix(c(2,0,1,3),2,2,byrow=TRUE), ratio1, ratio2, TRUE)
# ヒストグラム情報を記録
x.counts <- hist(x, right=FALSE, plot=FALSE)$counts
y.counts <- hist(y, right=FALSE, plot=FALSE)$counts
# 左下画面
par(mar=c(3,3,1,1)) # 余白指定
plot(x, y, xlim=range(x), ylim=range(y)) # 散布図作成
# 左上画面
par(mar=c(0,3,1,1)) # 余白指定
barplot(x.counts, ylim=c(0,max(x.counts)), space=0, col=0) # 上ヒストグラム
# 右下画面
par(mar=c(3,0,1,1)) # 余白指定
barplot(y.counts, xlim=c(0,max(y.counts)), space=0, horiz=TRUE, col=0) # 右ヒストグラム
}
x <- runif(100) # 一様分布の乱数
y <- rnorm(100) # 正規分布の乱数
layout.plot.hist(x,y) # 作図
layout.plot.hist(x,y,c(1,1),c(1,1)) # 作図
layout.plot.hist2 <- function(x,y, x2,y2, ratio1=c(3,1), ratio2=c(1,3)){
# (左下,左上,右下,右上)の順に(1,2,3,0) 0は描画しない 分割を縦横それぞれ設定
layout(matrix(c(2,0,1,3),2,2,byrow=TRUE), ratio1, ratio2, TRUE)
# ヒストグラム情報を記録
x.counts <- hist(x, right=FALSE, plot=FALSE)$counts
y.counts <- hist(y, right=FALSE, plot=FALSE)$counts
x.breaks <- hist(x, right=FALSE, plot=FALSE)$breaks
y.breaks <- hist(y, right=FALSE, plot=FALSE)$breaks
x2.counts <- hist(x2, right=FALSE, breaks=x.breaks, plot=FALSE)$counts
y2.counts <- hist(y2, right=FALSE, breaks=y.breaks, plot=FALSE)$counts
# 左下画面
par(mar=c(3,3,1,1)) # 余白指定
plot(x, y, xlim=range(x), ylim=range(y)) # 散布図作成
points(x2, y2, pch=16) # 塗りつぶし
# 左上画面
par(mar=c(0,3,1,1)) # 余白指定
barplot(x.counts, ylim=c(0,max(x.counts)), space=0, col=0) # 上ヒストグラム
barplot(x2.counts, ylim=c(0,max(x.counts)), space=0, col=1, add=T)
# 右下画面
par(mar=c(3,0,1,1)) # 余白指定
barplot(y.counts, xlim=c(0,max(y.counts)), space=0, horiz=TRUE, col=0) # 右ヒストグラム
barplot(y2.counts, xlim=c(0,max(y.counts)), space=0, horiz=TRUE, col=1, add=T)
}
x <- runif(100) # 一様分布の乱数
y <- rnorm(100) # 正規分布の乱数
x2 <- x[1:30] # 一様分布の乱数
y2 <- y[1:30] # 正規分布の乱数
layout.plot.hist2(x,y,x2,y2) # 作図
layout.plot.hist2(x,y,x2,y2,c(1,1),c(1,1)) # 作図
2007-01-10
GLMとGLMM[stat][r]
データの解析をしていてGLMM(一般化線形混合モデル)があるのを思い出した。久保さん(北海道大学)の デ−タ解析で出会う統計的問題--「個体差」のモデリングなどで解析[方法]を学んだ。そして、今回の自分のデータに、GLMMはあわないことがわかった。個体差・ブロック差を考慮した解析をするときにGLMMは使える。より詳しくはランダム効果とネストされた実験計画を読むと、どんな場合にGLMMを使えばいいかが分かる。沓掛さん(脳科学総合研究センター)の動物行動学者のための一般化線形混合モデル入門も分かりやすい
2007-01-07
調査結果を早くまとめる[stat][r]
生態学会の会長からのメッセージ(その20)で「できるだけ素早くデータをまとめるのがよい」というのが書かれている。確かにそうだと思う。たまってしまった標本を同定したり、遠い昔のデータを解析する気にはなかなかならない。
調査前や調査をしながら、作図結果が事前に想定できてれいば、調査を終えたらすぐにパソコンへ入力して、できるだけ早く解析するのが良い。細かな解析までは無理でも、大雑把な傾向を掴むぐらいの解析であれば、Rを使えばすぐにできる。
極論すれば、調査資料自体がなくても調査項目が決まれば、解析のプログラムだけを先に作っておくことは可能である。そうすれば、調査後すぐに解析結果を見渡せるだろう。一度はそんなことをしてみたいものだ。
2007-01-06
基礎的な作図[r][stat]
九州大学の粕谷さんが書かれている「馬車馬のように」にecological fallacyという項目を書かれている。生態学で間違いやすいことについて書かれており、その対策として基本的な作図をすることを説かれている。Rではいろいろな作図が簡単にできるので、間違いを減らす対策として使える。
2006-12-01
階級で区切ってから回帰分析[stat]
論文ではないが、とあるところで間違った解析方法を見つけてしまった。
階級ごとに区切り、平均値をとってしまって、回帰分析をしている。階級ごとに資料数が違うので、個々の点の重み付けが不均等になってしまうし、資料数が減るため相関係数もおかしくなる。また、階級値の区切り方によっても回帰分析の結果が変わってしまう。
Rで実行するならば、具体的には次のような感じ。
身長 <- c(147,162,170,155,168,164,172,171,151,157,174,172,163,189,185,189,181,171,183,178)
体重 <- c(57.5,58.9,72.1,49.7,68.8,52.7,74.1,60.5,52.6,48.5,74.0,72.4,60.4,79.8,76.2,75.1,72.7,73.4,78.2,67.5)
plot(体重~身長) # 本来の散布図
summary(lm(体重~身長)) # 本来の回帰分析
階級 <- cut(身長, breaks=seq(140,190,10), right=F, labels=c("145", "155", "165", "175", "185"))
階級値 <- tapply(体重, 階級, mean) # 階級ごとに平均値を算出
plot(階級値~as.numeric(names(階級値))) # 階級区分後の散布図
summary(lm(階級値~as.numeric(names(階級値)))) # 階級区分後の回帰分析
 Rの基礎とプログラミング技法
2006-10-27
入力間違い[stat]
「馬車馬のように」で「データの読み合わせ」という題名で書かれているデータの入力間違いについてはデータ解析をする上では必ず考えておかなければならない。
データ解析というか、パソコンを使う上では誰でも犯してしまう間違いであろう。エクセルで種名などを入力していると、オートコンプリート(自動補完)が働いて、入力すべきものでないまま確定してしまうこともある(例えば、ウラジロを入力すべきところにウラジロノキが入ってしまうなど)。
失敗をしない人間はいない。先のページに書かれている方法も含めて、データ入力や確認には次のような方法がある。
- 声に出して照合する(調査時の筆記では、必ず「復唱」をする)
データ確認用のプログラムを実行する
散布図やヒストグラムなどの図を作成する
2回データを入力する(2回の入力が異なるところは確認をする)
印刷をして確認する(確認したところは鉛筆で「はねる」)
割振った番号との照合などの場合は、チェックデジット(検査番号)を使用する
 S-PLUSによる統計解析
 自然科学の統計学
2006-10-18
集合[stat]
集合を図ではなくて、文章で表現しようと思うと難しい。含有関係や集合の表現を調べて、自分の言葉で表現。
Wikipedia:http://ja.wikipedia.org/wiki/%E9%9B%86%E5%90%88
A⊃B:AはBを含有する。
A∪B:和集合。AかBかどちらかにあるもの(両方にあるものも含む)。
A∩B:積集合。AとBの共通するもの。
A−B:差集合。Aにあって、Bにないもの。
2006-10-15
要素に順位を与える[r][stat]
思っている順序で要素が並ばないときには、順位を与えてやると良い。
layer <- factor(c("k2","k1","b2","b1","k1","s2","k1","b1","s1","k1","s2","s1","b2","b1","k1","s2")) # 順位なし
layer # 順序がばらばら
table(layer) # 集計してもばらばら
layer <- ordered(layer, levels=c("k2","k1","s2","s1","b2","b1")) # 階層に順位を与える
layer # 順位がついている
table(layer) # 集計が順位どおりにならぶ
2006-10-05
ヒストグラムと経験分布関数[stat][r]
馬車馬のようにの「ヒストグラム」のところをみて、確かにヒストグラムよりも慣れれば経験分布関数を図にした方が分布について詳しくわかる。ヒストグラムはある階級ごとに幅を区切ってしまうというために、視覚化すると同時に情報量を減らしてしまっている。経験分布関数は情報量をほとんど減らさずして、視覚化している。
参考:RjpWikiの「階段関数、経験分布関数」
2006-10-03
TWINSPANのプログラム[stat][tool]
このページを見たという方からメールを頂いた。そのやり取りの中でこれまで知っているものの他に、TWINSPANのプログラムがあることを教えてもらった。
Twinspan for Windows (WinTWINS):http://www.canodraw.com/wintwins.htm
CanoDraw for Windows Site:http://www.canodraw.com/
2006-08-23
種数-面積(地点数)曲線[stat][r]
種数-面積(地点数)曲線を描くための、関数specaccum(veganライブラリにある)のmethodの説明。基本的には規定値のexctで良さそう。具体的にどんな計算をしているのかは、関数の中身を見てみないと分からないが。
"collector": adds sites in the order they happen to be in the data (調査順に調査区を追加)
"random": adds sites in random order (無作為に調査区を追加)
"exact": finds the expected (mean) species richness (平均種数の期待値)
"coleman": finds the expected richness following Coleman et al. 1982 (Coleman(1982)による種数の期待値)
"rarefaction": finds the mean when accumulating individuals instead of sites (調査区でなく個体を追加)
2006-06-26
labdsvの関数一覧[r][stat]
Rのパッケージlabdsv(PDF形式の説明ファイル)に含まれる関数の一覧。日本語にしようと思ったけど、時間がかかりそうなのでとりあえず中途半端なまま。
abuocc # 種順位曲線 Abundance/Occurrence Graphical Analysis
brycesite # Bryce渓谷国立公園の地点データ Site Data for Bryce Canyon National Park
bryceveg # Bryce渓谷国立公園の植生データ Bryce Canyon Vegetation Data
const # Constancy Table
dga # 直接傾度分析 Direct Gradient Analysis
disana # 非類似度分析 Dissimilarity Analysis
dsvdis # 非類似度と距離 Dissimilarity Indices and Distance Measures
duarm # Indicator Species Analysis Minimizing Partial Occurrences
duleg # Dufrene-Legendreの指標種分析 Dufrene-Legendre Indicator Species Analysis
envrtest # Environmental Distribution Test
euclidify # Nearest Euclidean Spac eRepresentation of a Dissimilarity Object
importance # Importance Table
indspc # Compositional Indicator Species Analysis
metrify # Nearest Metric Space Representation of a Dissimilarity Object
nmds # Nonmetric Multidimensional Scaling
ordcomp # Ordination to Dissimilarity Comparison
ordpart # Ordination Partitioning
ordtest # Ordination Distribution Test
pca # 主成分分析 PrincipalComponentsAnalysis
pco # PrincipalCoordinatesAnalysis
plot.nmds # Plotting Routines For Nonmetric Multi-dimensional Scaling Ordinations
plot.pca # Plotting Routines For Principal Components Ordinations
plot.pco # Plotting Routines For Principal Coordinates Ordinations
rnddist # Random Distance
rndtaxa # Randomize a Taxa Data Frame
spcdisc # Species Discrimination Analysis
vardist # Variable Pairwise Difference
vegtab # Vegetation Table
vegtrans # Vegetation Data Transformation
2006-06-04
R Graphics[book][r][stat]
R Graphics

著者のページには R の命令と図がある。
<http://www.stat.auckland.ac.nz/~paul/RGraphics/rgraphics.html>
2006-06-01
クラスター分析結果で地点分割する関数[r][stat]
R のライブラリ cluster でクラスター分析をできる。ただ、その結果をわかりやすい形で取得できないので関数を作成した。同じような関数があるかもしれないと思っていたら、cutree() という関数があった。ほぼ同じ働きのようだ。
cut.cluster <- function(agnes, div=2, c.name=paste("cluster",as.character(1:div),sep="")){
# 入力データ
# agnes:library(cluster) の関数 agness() で解析した結果
# div:分割数
# c.name:クラスターの名称
if(div!=length(c.name)) return("分割数とクラスターの名称数が異なります") # エラーチェック
c.point <- agnes$height # 結合点
stand <- agnes$order # 地点名
# 1つに分割の場合:全部同ラスター
if(div==1) return(data.frame(stand=stand, cluster=rep(c.name[1], length(c.point)+1)))
# 要素数以上に分割:全部違うクラスター
if(div>=length(c.point)) return(data.frame(stand=stand, cluster=paste("cluster",as.character(1:(length(c.point)+1)),sep="")))
thres <- sort(c.point, decreasing=T)[div] # 閾値を設定
j <- 1
cluster <- c.name[j]
for(i in 1:length(c.point)){
if(c.point[i]>thres) j <- j+1 # 次のクラスター
cluster <- c(cluster, c.name[j])
}
data.frame(stand=stand, cluster=cluster)
}
使用例
install.packages(c("cluster", "vegan")) # パッケージのインストール
library(vegan)
library(cluster)
data(dune)
cluster <- agnes(dune)
div.cluster(cluster)
2006-05-22
データ変換の関数[stat][r][db]
エクセルなどの表計算ソフトで作成したデータと垰田宏さんが作成された植生データベースの作成・修正プログラム(FVD4)と組成表の作成プログラム(FVT4)で使用できる標準互換テキストとのデータ相互変換関数を R で作成した。
使用方法は以下のとおり。十分な動作確認を試験していないので、不具合があるかも。
R については、Rについての書籍やRjpWikiを参考にしてください。
source("d:/fv.r") # 関数の読込:関数を保存した場所を指定する
df <- std2df("D:/VegSample.txt") # 標準互換テキストを読み込んで表計算形式に変換
write.table(df$st, file="D:/st.txt", quote=F, sep="\t", row.names=F) # 地点関連データの出力
write.table(df$comp, file="D:/comp.txt", quote=F, sep="\t", row.names=F) # 組成関連データの出力
std <- df2std("D:/") # 表計算形式のデータを読み込んで標準互換テキストに変換
write.table(std, file="D:/std.txt", quote=F, row.names=F, col.names=F) # 標準互換テキストで出力
2006-04-20
相関の強さ[stat]
相関係数の強さの解釈について、用語の使い方をよく忘れてしまうのでメモ。
ピアソンの積率相関係数の表2
相関係数の解釈
相関係数の絶対値 解釈 解釈 0.0〜0.2 ほとんど相関関係がない ほとんど相関なし 0.2〜0.4 やや相関関係がある 弱い相関あり 0.4〜0.7 かなり相関関係がある やや相関あり 0.7〜1.0 強い相関関係がある かなり強い相関がある
2006-03-21
matplotのような散布図を描く関数[stat][r]
matplot のような関数
関数
matplot4 <- function(df, pch=NULL, ...){ # df:data1,data2,label
plot(df[[1]], df[[2]], type="n", ...) # 空のグラフ
label <- unique(df[[3]]) # ラベルの数
if(is.null(pch)) pch <- 1:length(label) # pchの指定無:通常の順番
for(i in 1:length(label)){ # ラベルごとに散布図を描画
sub.df <- subset(df, df[[3]]==label[i])
points(sub.df[[1]], sub.df[[2]], pch=pch[i], ...)
}
}
使用例
df <- list(x=rnorm(50), y=rnorm(50), z=sample(c("a","b","c","d","e","f"),10,replace=T))
df <- as.data.frame(df)
matplot4(df, pch=c(1,2,0,16,17,15))
2006-03-20
図で使う記号(凡例)[book][論文][stat][r]
参考文献によると、基本的には次の順番で使うらしい。
○ △ □ ● ▲ ■
R の pch では ○:1 △:2 □:0 ●:16 ▲:17 ■:15
plot(rep(1,6), pch=c(1, 2, 0, 16, 17, 15), cex=5) # cex でシンボルの大きさを5倍に変更
参考文献: トップジャーナルにアクセプトされる医学論文―執筆と投稿のキーポイント
2006-02-06
ポワソン分布モデルでの回帰分析[stat][r]
久保拓弥さんの計算機実験用ランダム標本集団の飼い方・しつけ方のp27(ポアソン分布)にあるポワソン分布モデルでの回帰分析する定義
関数
pois.plot <- function(x, y=NULL, ...){ # x(種数など), y(環境傾度など) データフレームとして与えてもOK
if (is.null(y)){ y <- x[[2]]; x <- x[[1]] } # 引数が1つのデータフレームの場合はxとyに分割
pois <- glm(y ~ 1 + x, family = poisson(link = "log")) # ポワソン分布モデル
curve( exp(pois[[1]][1] + pois[[1]][2] * x), xlim=range(x), ...) # 推定した曲線を描画
points(x,y) # 散布図をプロット
summary(pois)
}
サンプルデータ
beta0 <- 4
beta1 <- -0.01
x <- seq(from = 0, to = 200, by = 2)
y <- exp(beta0 + beta1 * x)
sample <- rpois(length(y), lambda = y)
pois.plot(x,sample)
参考
http://aoki2.si.gunma-u.ac.jp/lecture/mb-arc/arc026/01281.html
http://cse.naro.affrc.go.jp/takezawa/r-tips/r/72.html
http://www1.doshisha.ac.jp/~mjin/R/15.pdf

2006-01-31
統計結果の書き方[stat][論文]
Japanese Journal of Clinical Oncology投稿に際しての統計解析結果のレポートに関するガイドラインのテキストファイル(PDFファイル)は論文の統計解析結果を書くときだけでなく、研究計画を作成するときにも役立つ内容だ。
以下、ちょっと長いが特に有用だと思うところを引用。
1-2-2 p値の示し方(Exact p-value)
統計学的に有意でなかった検定の結果を、一律に“N.S.”や“not significant(有意差なし)”と示すよりも、例えばP=0.23のような実際のp値(Exact p-value)として示す方が望ましい。
表や図の中で示されるp値は本文の中で繰り返される必要はない。通常、p値は小数点以下3ケタ(P=0.025、P=0.003)まで示されるが、p値が0.1より大きい場合には、P=0.25のように小数点以下2ケタで充分である。非常に小さいp値の時はP < 0.001やP < 0.0001のように示して構わない。“p”でも“P”でもどちらでもよいがP(大文字イタリック)が国際標準である。
1-2-3 点推定値と信頼区間
2) 平均値は通常、元のデータを越える有効ケタ数を示す必要はないが、標準偏差や標準誤差は元のデータより1ケタ多く示す。割合をパーセントで示す場合、 56.47%というように小数点以下2ケタまで示す必要があることは稀であり、特に例数が少ない時には38.6%のように小数点1ケタを示すことも必要でない場合も多い。極めて少ない例数における割合の表示でパーセントを用いることは避けるべきである(例:1/1=100%、2/2=100%)。tや χ2、rのような検定統計量は小数点以下2ケタで充分である。ただし、これらの注意点は結果の表示の際の話であって、解析の途中では(切り上げ、切り捨て、四捨五入のような)まるめは行うべきではない。
2-1-3 統計学的有意性と臨床的意義
例数が充分に多い(sample sizeが大きい)場合は、小さい差であっても“統計学的有意”となりうる。仮想的には1500例以上を登録する無作為化比較試験では5年生存率で5%以下に相当する小さな(生存時間分布の)差を検出できることになる。こうした小さな差が仮に“統計学的に有意”であったとしても、個々の患者の治療においては臨床的に必ずしも重要であると言えない場合があるだろう。一方、例数が少なくて、非常に大きな差であっても“統計学的有意差”が得られない場合があるが、それが臨床的に重要な差であるとみなせるならば単に“有意差がない”として無視されるべきではなく、さらなる検討の対象とされる(新たな臨床研究を行う)べきであろう。研究者は「統計学的有意差」と「臨床的な重要性」を明確に区別する必要があり、“臨床的に意味のある差”を検出し得るような研究デザインを組むべきである。
2-1-5 確定的か探索的か?
確定的なデータ解析か、探索的なデータ解析かは常に区別されなければならない。
探索的データ解析の弱点は先述した多重性である。すべての探索的データ解析の結論は「さらなる検討を行う必要があり、かつその価値がある」か、「これ以上検討の価値がない」かのどちらかである。いかに“高度に有意な”結果が得られようとも基本的には同じである。なぜなら、予め計画された以外の探索的な解析では、自由に何通り(何十通り、何百通り)もの計算が可能であるため、意図したかそうでないかに関わらず“差のありそうな”比較に注目して進められた(“fishing”と呼ばれる)可能性が常にあり、“たまたまその時だけ偶然に出た(有意)差”を拾っているに過ぎないことを否定できないからである。
2006-01-20
統計解析のための DLL[stat]
統計解析のための DLL(Dynamic Link Library)はwindows上で動くDLLを提供しているとのこと。S-PLUSで利用可能とのこと。Rでも動くのだろうか?試してみたいが、使い方が良く分からないのと当面は使う必要がなさそうなので実験せず。必要がでてきたらやってみよう。
2006-01-12
統計の使い方[stat]
また、普段は統計学を分かりにくい道具だとして考えがちであるものの、そうではなくて、本来ならばすべての母集団を調べなければ分からないことを、少しのサンプルで明らかにするための道具だとして考えると、もっとフレンドリーに統計を使えるようになるのではないかということを聞いた。この統計の考え方は、言い方は違うけど根本的には少し前に知人の送ったメールで書いた文章「得られた標本の数値の大小というのは、事実としてありますが、その母集団はどうなのか、というのが検定です。論文の結果で直接に論じるのは標本ですが、それが母集団でも同じ性質を持っているといえなければ、論を一般化できません。」というのと同じだろう。聞いた話は建設的な話し方で、自分の文章は否定的な書き方なので、前者のほうが聞き手(読み手)にとっては受け入れやすいでしょうね。いずれにせよ、統計とはうまく付き合わないといけない。