ҫҫВјҪУПВӨОҘЪЎјҘёЎ§Жьөӯ / 2008-09
01 02 03 04 05 06 07 08 09 10 11 12 13 14 15 16 17 18 19 20 21 22 23 24 25 26 27 28 29 30
2009 : 01 02 03 04 05 06 07 08 09 10 11 12
2008 : 01 02 03 04 05 06 07 08 09 10 11 12
2007 : 01 02 03 04 05 06 07 08 09 10 11 12
2006 : 01 02 03 04 05 06 07 08 09 10 11 12
2008-09-01
јхНэДМГО[ҝК№Фҫх¶·]
[2008-08-27]ӨЛәЖЎ№Ў№Ек№ЖӨ·ӨҝПАКёӨОјхНэДМГОӨтБчӨГӨҝӨИӨОПўНнӨтДәӨӨӨҝЎҘәәЖЙӨтӨ·ӨЖӨӨӨҝӨАӨӨӨҝКэЎӨКФҪё°С°чӨОКэӨЛӨПВзКСӨӘАӨПГӨЛӨКӨкӨЮӨ·ӨҝЎҘӨўӨкӨ¬ӨИӨҰӨҙӨ¶ӨӨӨЮӨ·ӨҝЎҘ
ӨіӨОПАКёӨтҪйӨбӨЛЕк№ЖӨ·ӨҝӨОӨП[2008-02-06]ЎҘӨҪӨОЖьӨОЖьөӯӨтё«ӨлӨИЎӨӨБӨзӨҰӨЙ»сОБӨОјхНэДМГОӨтӨвӨйӨГӨҝЖьӨЛЕк№ЖӨ·ӨҝӨиӨҰӨАЎҘұСёмӨОПАКёӨО·лІМӨ¬өўӨГӨЖӨҜӨлБ°ӨЛЎӨјЎӨОПАКёӨтНС°ХӨ·ӨҝӨӨЎҘӨЗӨвЎӨҝўАёіШІсӨОИҜЙҪӨдёҪГПДҙәәӨ¬ӨўӨлӨОӨЗӨКӨ«ӨКӨ«ЖсӨ·ӨҪӨҰӨАЎҘ
Referrer (Inside):
[2008-11-01-7] [2008-09-02-1]
2008-09-02
ёҰөжА®ІМ[hp][diary]
әтЖь([2008-09-01])јхНэДМГОӨтБчӨГӨҝӨИӨОПўНнӨтДәӨӨӨЖӨӨӨҝјхНэДМГОӨ¬ЖПӨӨӨҝӨОӨЗЎӨј«ёКҫТІрӨЛӨҪӨОПАКё(a-07)ӨтДЙІГӨ·ӨҝЎҘ
Referrer (Inside):
[2008-12-31-5]
2008-09-03
МВПЗҘбЎјҘлӨИӨ·ӨЖИҪДкӨ·ӨКӨӨ[google][hp]
ҪйӨбӨЖӨОҝНӨдЙСЕЩӨ¬ИуҫпӨЛҫҜӨКӨӨҝНӨ«ӨйӨОҘбЎјҘлӨПЎӨGmailӨЗМВПЗҘбЎјҘлӨЛИҪДкӨөӨмӨлӨіӨИӨ¬ӨўӨлЎҘАиЖьӨПӨҪӨмӨЫӨЙҪЕНЧӨЗӨПӨКӨӨӨвӨОӨОЎӨДМҫпӨОҘбЎјҘл1ДМӨ¬GmailӨОГКі¬ӨЗМВПЗҘбЎјҘлӨЛИҪДкӨөӨмӨЖӨӨӨҝЎҘҘбЎјҘйЎјӨОАЯДкӨЗӨПЎӨЖГДкӨОёАНХӨ¬ҙЮӨЮӨмӨлҫм№зӨПЎӨМВПЗҘбЎјҘлӨЛӨ·ӨКӨӨӨИӨӨӨҰАЯДкӨ¬ӨЗӨӯӨлЎҘGmailӨЗӨПӨҪӨОӨиӨҰӨКөЎЗҪӨ¬МөӨӨӨИ»ЧӨГӨЖӨӨӨҝЎҘҘХҘЈҘлҘҝӨОАЯДкӨтӨ·ӨЖӨӨӨҝӨйЎӨӨЮӨөӨ·ӨҜӨҪӨОөЎЗҪӨ¬ӨўӨлӨіӨИӨЛөӨӨЕӨӨӨҝӨОӨЗЎӨБбВ®ЎӨҙБ»ъӨИҘнЎјҘЮ»ъӨОМҫБ°ӨтЕРПҝӨ·ӨҝЎҘ
ӨЮӨҝЎӨҘбЎјҘлҘўҘЙҘмҘ№ӨтҪсӨӨӨҝҘЪЎјҘёӨЛҙБ»ъӨўӨлӨӨӨПҘнЎјҘЮ»ъӨЗМҫБ°ӨтҪсӨӨӨҝӨйМВПЗҘбЎјҘлӨЛИҪДкӨөӨмӨЛӨҜӨӨ»ЭӨтҪсӨӨӨЖӨӘӨӨӨҝЎҘ
2008-09-04
өТҙСЕӘӨЛё«Өл[diary]
ј«К¬Ө¬ҪсӨӨӨҝКёҫПӨтөТҙСЕӘӨЛё«ӨлӨОӨПИуҫпӨЛЖсӨ·ӨӨЎҘӨҪӨОЕАЎӨВҫҝНӨЛё«ӨЖӨвӨйӨҰӨИөТҙСЕӘӨЛИгИҪӨтјхӨұӨлӨіӨИӨ¬ӨЗӨӯӨлӨОӨЗӨўӨкӨ¬ӨҝӨӨЎҘјЎӨОПАКёӨЛёюӨұӨЖЎӨ¶ҰЖұёҰөжјФӨЛКёҫПӨтё«ӨЖӨвӨйӨГӨЖЎӨӨўӨйӨҝӨбӨЖҙ¶ӨёӨҝЎҘӨвӨБӨнӨуЎӨј«К¬ј«ҝИӨЗӨвҪРНиӨлӨАӨұӨОЕШОПӨПӨ№ӨлӨ·ЎӨІҝЕЩӨвКёҫПӨтЖЙӨуӨЗіОЗ§ӨтӨ№ӨлЎҘӨҪӨмӨЗӨвЎӨӨдӨПӨкЖсӨ·ӨӨӨвӨОӨПЖсӨ·ӨӨЎҘЎЦј«К¬ӨОӨіӨИӨПөТҙСЕӘӨЛё«ӨлӨіӨИӨ¬ӨЗӨӯӨлЎЧӨИј«ҝ®Өт»эӨГӨЖёАӨЁӨлӨиӨҰӨЛӨКӨкӨҝӨӨӨвӨОӨАЎҘ
Referrer (Inside):
[2008-10-13-1]
2008-09-05
ҝўАёіШІсӨОИҜЙҪНЧ»Э[2008ҝўАёіШІс]
Ө·ӨРӨйӨҜБ°ӨЛҝўАёіШІсӨО№ЦұйНЧ»Э(PDFҘХҘЎҘӨҘл)ӨтәоА®Ө·ЎӨВзІс»цМі¶ЙӨЛБчӨГӨҝЎҘЕцЖьӨОИҜЙҪНСӨО»сОБӨПҪаИчГжЎҘИҜЙҪНСӨО»сОБӨОәоӨкКэӨтј«К¬НСӨЛҪсӨӨӨЖӨӘӨіӨҰЎҘ
ЛЬКёӨПLaTeXӨЗәоА®Ө·ЎӨPSӨт·РНіӨ·ӨЖPDFӨЛКСҙ№
јМҝҝӨПVixӨЗ85%ӨО1280*1024ӨЛКСҙ№Ө·ЎӨAcrobatӨЗPDFӨИӨ·ӨЖ·л№з
ҝЮӨПRӨЗPDFӨтәоА®
ЛЬКёЎҰјМҝҝЎҰҝЮӨтConcatPDFӨЗ·л№з
2008-09-06
ИҜЙҪ»сОБ[2008ҝўАёіШІс]
ЕкұЖ»сОБӨОНҪДкЛзҝфӨП20ЛзӨ°ӨйӨӨЎҘӨҰӨБЎӨ»чӨҝӨиӨҰӨКӨвӨОӨ¬4ЛзӨЫӨЙӨўӨГӨҝӨкЎӨјМҝҝӨАӨұӨОӨвӨОӨ¬ӨўӨлӨОӨЗЎӨјВјБЕӘӨЛӨП15ЛзӨ°ӨйӨӨЎҘИҜЙҪ15К¬ЎӨјБөҝ5К¬ӨКӨОӨЗЎӨӨБӨзӨҰӨЙӨиӨӨӨ°ӨйӨӨӨОИҜЙҪЖвНЖӨЛӨКӨкӨҪӨҰЎҘ20ЛзӨОӨҰӨБ8ідӨП°мұюәоА®Ө·ӨҝЎҘ»ДӨкӨП»юҙЦӨ¬Ө«Ө«ӨкӨҪӨҰӨКӨвӨОӨРӨ«ӨкӨ¬»ДӨГӨЖӨӨӨлЎҘБҙЙфәоА®Ө·ӨҝӨйЎӨё¶№ЖӨтәоА®Ө·ӨЖЎӨК¬ОМӨОДҙА°ӨтӨ·ӨДӨДЎӨЕкұЖ»сОБӨОҪӨАөӨтӨ№ӨлЎҘ
ИҜЙҪ»юҙЦӨЛӨДӨӨӨЖіОЗ§Ө№ӨлӨҝӨбЎӨҝўАёіШІсВи13ІуВзІсӨО°мИМ№ЦұйӨОӨИӨіӨнӨтё«ӨҝӨйЎӨ¶ІӨнӨ·ӨӨӨіӨИӨ¬ҪсӨ«ӨмӨЖӨӨӨҝЎҘЎЦИҜЙҪ»юҙЦӨП№Цұй15К¬ЎӨјБөҝұюЕъ5К¬ӨО№з·Ч20К¬ӨтНҪДкӨ·ӨЖӨӨӨЮӨ№ЎҘҝҪ№юҝфӨЛӨиӨГӨЖӨПЎӨӨіӨмӨиӨкГ»ӨҜӨКӨлӨіӨИӨвӨўӨкӨЮӨ№ЎЧЎҘ
Referrer (Inside):
[2008-09-16-1]
2008-09-07
ҘкҘПҘУҘкДҙәә[diary]
Му1ЗҜӨЦӨкӨЛЛЬДҙәәӨтӨ·ӨҝЎҘҪлӨӨӨОӨИөЧӨ·ӨЦӨкӨКӨОӨ¬ҪЕӨКӨГӨЖЎӨӨ·ӨРӨйӨҜДҙ»ТӨ¬ҪРӨКӨӨЎҘДҙәә»юҙьӨОҪйӨбӨП(ҫпӨЛЎ©)МөНэӨ»ӨәӨЛДҙәәӨтӨ№ӨлӨиӨҰӨЛҝҙӨ¬ӨұӨЖӨӨӨлЎҘМөНэӨКДҙәәӨтӨ№ӨлӨИЎӨ»цёОӨОӨвӨИӨАӨ·ЎӨДҙәәАәЕЩӨ¬°ӯӨҜӨКӨлЎҘ
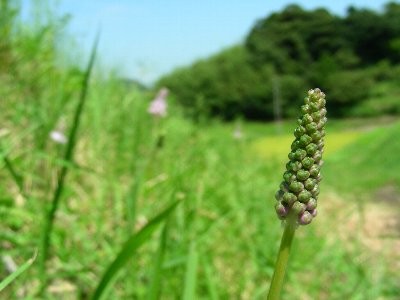
ҘӯҘДҘНҘОҘ«ҘЯҘҪҘкЎҰҘДҘлҘЬ[photo][plant]
ҘӯҘДҘНҘОҘ«ҘЯҘҪҘкӨ¬әйӨӨӨЖӨӨӨлӨИН§ҝНӨ«Өй¶өӨЁӨЖӨвӨйӨГӨҝӨОӨЗЎӨё«ӨЛ№ФӨГӨҝЎҘҘӯҘДҘНҘОҘ«ҘЯҘҪҘкӨПӨўӨЮӨкЙСИЛӨЛё«Ө«ӨұӨлӨвӨОӨЗӨПӨКӨӨЎҘӨҪӨіӨЛӨПЎӨҘӯҘДҘНҘОҘ«ҘЯҘҪҘкӨ¬·ІАёӨ·ӨЖӨӨӨлӨИӨИӨвӨЛЎӨҘДҘлҘЬӨвӨҝӨҜӨөӨуАёӨЁӨЖӨӨӨҝЎҘ


ДҙәәГПӨЛӨвҘДҘлҘЬӨ¬АёӨЁӨЖӨӨӨҝЎҘҘДҘлҘЬӨПӨДӨЬӨЯӨвӨКӨ«ӨКӨ«јсӨ¬ӨўӨлЎҘ
Referrer (Inside):
[2009-03-13-1]
2008-09-08
¶ҰЖұёҰөж[diary]
¶ҰЖұёҰөжӨтӨ·ӨЖӨӨӨлӨИЎӨӨӨӨӨӨіӨИӨ¬ӨҝӨҜӨөӨуӨўӨлЎҘіЖҝНӨОАмМзК¬МоӨтіиӨ«Ө№ӨіӨИӨ¬ӨЗӨӯӨлЎҰБкёЯӨтөТҙСЕӘӨЛё«ӨлӨіӨИӨ¬ӨЗӨӯӨлЎҰДщӨбАЪӨкӨтјйӨл(јйӨнӨҰӨИЕШОПӨ№Өл)ЎҰП«ОПӨтК¬»¶ӨўӨлӨӨӨПҪё·лӨЗӨӯӨлӨКӨЙӨКӨЙЎҘӨҝӨАЎӨМтідК¬ГҙӨдәо¶ИЖьДшӨ¬ЫЈЛжӨК¶ҰЖұёҰөжӨЗӨПЎӨөХёъІМӨЛӨКӨГӨЖӨ·ӨЮӨҰЎҘіЖҝНӨ¬ВҫҝНӨтӨўӨЖӨЛӨ·ӨЖ·лІМЕӘӨЛГҜӨвІҝӨвӨ·ӨКӨӨӨИӨӨӨҰӨіӨИӨ¬ӨўӨлЎҘ
ӨіӨмӨПЎӨГұЖИёҰөжӨЗӨвЖұӨёӨіӨИӨЗЎӨМКМ©ӨЛОэӨйӨмӨҝёҰөж·ЧІиӨОНӯМөӨ¬ҪЕНЧӨЗЎӨНЧӨПГҜӨ¬Іҝ»юӨЮӨЗӨЛӨЙӨОӨиӨҰӨККэЛЎӨЗІҝӨтӨ№ӨлӨОӨ«Ө¬·иӨЮӨГӨЖӨӨӨлӨ«ӨЙӨҰӨ«ӨАЎҘ
2008-09-09
ЖьЎ№ӨОА°Нэ[diary]
әо¶ИӨтӨ·ӨЖӨӨӨлГжӨЗЎӨЖьЎ№ӨОА°НэА°ЖЬӨ¬ӨўӨЮӨкӨЛГжЕУИҫГјӨКӨОӨЛөӨӨЕӨҜЎҘДҙәә»сОБӨОЖюОПЎӨTeXӨОҘ№ҘҝҘӨҘлҘХҘЎҘӨҘлЎӨ¶ИАУӨОА°НэӨ¬ГжЕУИҫГјЎҘӨҪӨО»юЎ№ӨЛӨӯӨГӨБӨкӨИА°НэӨ·ӨЖӨӘӨұӨРЎӨП«ОПӨ¬ҫҜӨКӨҜӨЖӨ№ӨаӨОӨЛЎӨӨўӨИӨ«ӨйА°НэӨ№ӨлӨИ»сОБј«ВОӨ¬»¶НрӨ·ӨЖӨӨӨҝӨкӨ·ӨЖЎӨНҫ·ЧӨЛ»юҙЦӨ¬Ө«Ө«ӨлЎҘ
ҝфӨ¬ҫҜӨКӨұӨмӨРА°НэӨ№ӨлЙ¬НЧӨ¬МөӨҜЎӨҪйӨбӨОГКі¬ӨЗӨПА°НэӨОКэЛЎӨт·иӨбӨЖӨӨӨКӨӨЎҘҝфӨ¬БэӨЁӨЖӨӯӨҝГКі¬ӨЗА°НэӨтӨ·ӨиӨҰӨИӨ№ӨлӨвӨОӨОЎӨА°НэӨО»ЕКэӨтӨБӨгӨуӨИ·иӨбӨКӨӨӨЮӨЮА°НэӨЛӨ«Ө«ӨГӨЖӨ·ӨЮӨҰЎҘӨөӨйӨЛҝфӨ¬ВҝӨҜӨКӨлӨИЎӨӨӯӨГӨБӨкӨИА°НэӨО»ЕКэӨт·иӨбӨКӨұӨмӨРӨКӨйӨКӨӨЎҘҫеөӯӨО3ӨДӨИӨвЎӨӨБӨзӨҰӨЙҝфӨ¬ВҝӨҜӨКӨкӨДӨДӨўӨлГКі¬ӨАЎҘ
ӨҝӨАӨ·ЎӨА°НэА°ЖЬӨ¬ҙ°БҙӨЛҪРНиӨЖМөӨҜӨЖӨвЎӨӨИӨкӨўӨЁӨәӨОәо¶ИӨтӨ№ӨлӨЛӨПәӨӨйӨКӨӨДшЕЩӨЛӨПА°НэӨөӨмӨЖӨӨӨлЎҘОгӨЁӨРЎӨДҙәә»сОБӨЗМӨЖюОПӨКӨОӨПЎӨДҙәәГПЕАӨО°ЮЕЩ·РЕЩӨИӨӨӨГӨҝІтАПӨЗӨПДҫАЬЕӘӨЛӨП»ИӨпӨКӨӨӨиӨҰӨКҫрКуӨАЎҘёеЎ№ӨЛЎӨДЙАЧДҙәәӨтӨ№ӨлӨИӨӯӨЛӨПЙ¬НЧӨЛӨКӨлӨОӨЗЎӨӨдӨГӨСӨкА°НэӨ·ӨЖӨӘӨҜӨОӨ¬ҙОҝҙӨАЎҘ
Referrer (Inside):
[2008-09-26-1] [2008-09-18-1]
2008-09-10
ҝЮҫеӨО°МГЦӨтГОӨл[r]
ВРПГЕӘәоҝЮҙШҝфӨИӨӨӨҰӨОӨ¬ӨўӨГӨЖЎӨlocator()Өт»ИӨҰӨИҝЮҫеӨОәВЙё°МГЦӨтГОӨлӨіӨИӨ¬ҪРНиӨлЎҘplot()ӨЗЕ¬ЕцӨКәоҝЮӨтӨ·ӨЖЎӨјЎӨЛЎӨlocator()ӨИӨ№ӨлӨИЎӨЙБІиІиММҫеӨЛҪҪ»ъӨО°хӨ¬ӨЗӨЖӨҜӨлЎҘӨіӨмӨЗГОӨкӨҝӨӨ°МГЦӨтҘҜҘкҘГҘҜ(КЈҝфІД)Ө·ЎӨҪӘӨпӨмӨРЎӨұҰҘҜҘкҘГҘҜӨЗҪӘО»ӨтІЎӨ№ЎҘӨ№ӨлӨИЎӨҘіҘуҘҪЎјҘлҫеӨЛҘҜҘкҘГҘҜӨ·Өҝ°МГЦӨОҫрКуӨ¬ЙҪјЁӨөӨмӨлЎҘӨЮӨҝЎӨ°КІјӨОӨиӨҰӨЛӨ№ӨлӨИЎӨӨҪӨО°МГЦӨтҘӘҘЦҘёҘ§ҘҜҘИӨЛВеЖюӨЗӨӯӨлЎҘ
x <- locator()
2008-09-11
ИҜЙҪНСӨО°МГЦҝЮ[r]
·ІЗПВзіШӨОАДМЪӨөӨуӨ¬әоӨйӨмӨҝҙШҝф·ІӨЛӨўӨлdraw.map()Өт»ИӨҰӨИЎӨҙКГұӨКЖьЛЬГПҝЮӨдЕФЖ»ЙЬё©КМӨОГПҝЮӨтЙБӨҜӨіӨИӨ¬ӨЗӨӯӨл(»ІҫИЎ§ГПҝЮӨтЙБӨҜ)ЎҘ
draw.map()ӨтҫҜӨ·ҪӨАөӨ·ӨҝҙШҝфӨтәоӨГӨЖЎӨӨҪӨмӨт»ИӨГӨЖҝўАёіШІсВи13ІуВзІсӨЗӨОёэЖ¬ИҜЙҪНСӨОЕкұЖ»сОБӨЗ»ИӨҰ°МГЦҝЮӨтәоА®Ө·ӨҝЎҘ°КІјЎӨҙШҝфӨИӨ«ЎҘ
# ҙрБГЕӘӨКАЯДкӨтӨ№ӨлҙШҝфӨҝӨБ
set.par <- function(){ # ҝ§ӨКӨЙӨОАЯДк
bg <- "darkblue"
fg <- "white"
par(bg=bg, fg=fg, col.axis=fg, col.lab=fg, col.main=fg, col.sub=fg) # ҝ§ӨОАЯДк
par(omi=c(0.3, 0.3, 0.3, 0)) # БҙВОӨОНҫЗтӨтҘӨҘуҘБАЯДк
par(cex=cex, cex.lab=cex, cex.main=cex, cex.sub=cex)
layout(matrix(c(1,2), nrow=1), width=c(2.2,1), TRUE) # әоҝЮІиММӨтК¬ід
}
clear.plot <- function(n=10) plot(c(0,n), c(0,n), type="n", ann=F, axes=F) # ¶х(Ө«Өй)ӨО»¶ЙЫҝЮ
# draw.mapӨОҪӨАө(АюЙэӨИӨҪӨОВҫӨО°ъҝфӨОДЙІГ)
# http://aoki2.si.gunma-u.ac.jp/R/src/all.R »ІҫИ
draw.map2 <- function(fn, lwd=1, ...){ # ¶ӯіҰАюҘЗЎјҘҝӨОӨўӨлҘХҘЎҘӨҘлМҫ
data <- matrix(scan(fn, quiet=TRUE), ncol=2, byrow=TRUE) # x, y әВЙёӨ¬БИӨЯӨЛӨКӨГӨЖӨӨӨл
continue <- apply(data, 1, any) # x, y әВЙёӨ¬¶ҰӨЛ 0 ӨЗӨўӨлӨОӨПЎӨ°мПўӨО¶ӯіҰАюӨОҪӘӨпӨкӨт°ХМЈӨ№Өл
plot(data, type = "n", axes=FALSE, bty="n", asp=1, ...) # ПИБИӨЯӨтӨИӨл
start <- 1
for (i in 2:nrow(data)) {
if (continue[i] == FALSE) { # °м¶иАЪӨк
lines(data[start:(i-1),], lwd=lwd) # (0, 0) ӨОјЎӨ«ӨйЎӨ(0, 0) ӨОБ°ӨЮӨЗӨтАЮӨмАюӨЗ·лӨЦ
start <- i+1
}
}
}
# °МГЦҝЮӨОЙБІи
cex <- 1.8
pdf("d:/hoge/hoge.pdf", family="Japan1", width=11.69, height=8.26) # ҘХҘЎҘӨҘл°МГЦӨПЕ¬ө№КС№№
set.par()
par(mai=c(4.5, 1, 1, 4.5)) # ёДЎ№ӨОНҫЗтӨтҘӨҘуҘБАЯДк
draw.map2("D:/hoge/jpn.dat", ann=F, lwd=0.5) # ҘХҘЎҘӨҘл°МГЦӨПЕ¬ө№КС№№
box()
par(new=T)
par(mai=c(1.2, 1, 1, 0)) # ёДЎ№ӨОНҫЗтӨтҘӨҘуҘБАЯДк
draw.map2("D:/hoge/hyougo", ann=F, lwd=0.5) # ҘХҘЎҘӨҘл°МГЦӨПЕ¬ө№КС№№
box()
par(mai=c(0, 0.2, 0, 0))
clear.plot()
text(x=-0.4, y=9.0, "ӨіӨіӨЛАвМАӨтДЙІГ", adj=0, cex=cex) #
dev.off()
2008-09-12
Ҙ«ҘпҘ»ҘЯ[diary]
өЧЎ№ӨЛҘ«ҘпҘ»ҘЯӨтё«ӨҝЎҘҘіҘРҘлҘИҘЦҘлЎјӨ¬Ө№ӨРӨдӨҜ°ЬЖ°Ө№ӨлӨОӨ¬ё«ӨЁӨҝЎҘӨЫӨуӨО°мҪЦӨАӨГӨҝЎҘӨҪӨмӨЫӨЙДБӨ·ӨӨӨвӨОӨЗӨПӨКӨӨӨвӨОӨОЎӨӨҝӨЮӨЛӨ·Ө«ӨӘМЬӨЛӨ«Ө«ӨйӨКӨӨӨОӨЗЎӨё«ӨДӨұӨлӨИЖАӨтӨ·ӨҝөӨӨЛӨКӨлЎҘ
2008-09-13
2008-09-14
Biodiversity and Conservation 17 11[article]
DOI: 10.1007/s10531-008-9348-x
DOI: 10.1007/s10531-007-9265-4
2008-09-15
ҘРЎјҘаҘҜЎјҘШҘу[diary]
ӨіӨіӨОӨИӨіӨнЎӨҘРЎјҘаҘҜЎјҘШҘуӨтҝ©ӨЩӨлөЎІсӨ¬ВҝӨҜӨўӨГӨҝЎҘҝ©ӨЩӨл»юӨЛӨПӨДӨӨӨДӨӨОШӨОҝфӨтҝфӨЁӨЖӨ·ӨЮӨҰЎҘ
2008-09-16
ҘЧҘнҘ°ҘйҘа[2008ҝўАёіШІс]
ҝўАёіШІсВи13ІуВзІсӨОҘЧҘнҘ°ҘйҘаӨ¬БчӨйӨмӨЖӨӯӨҝ(ВзІсҘөҘӨҘИЖвӨОPDFҘХҘЎҘӨҘл)ЎҘёэЖ¬ИҜЙҪӨО»юҙЦӨП20К¬ӨўӨлӨиӨҰӨЗЎӨӨиӨ«ӨГӨҝ([2008-09-06])ЎҘӨЮӨҝЎӨ»юҙЦВУӨП6ИЦМЬӨО10:40Ө«ӨйӨИӨӨӨҰӨіӨИӨЗӨЮӨәӨЮӨәЎҘ»ДЗ°ӨКӨОӨПЎӨӨвӨҰ1ӨДӨОІсҫмӨОИҜЙҪӨтК№ӨұӨКӨӨӨіӨИЎҘ
2008-09-17
ИҜЙҪОэҪ¬[2008ҝўАёіШІс]
ИҜЙҪӨОЕкұЖ»сОБӨ¬ӨАӨӨӨҝӨӨҪРНиӨҝӨОӨЗЎӨ°мҝНӨЗНҪ№ФұйҪ¬ӨЯӨҝӨӨӨКӨОӨтӨдӨГӨЖӨЯӨҝЎҘӨЮӨГӨҝӨҜВММЬЎҘӨ№ӨҙӨҜК¬Ө«ӨкӨЛӨҜӨӨЎҘӨдӨГӨСӨк°мЕЩё¶№ЖӨтәоА®Ө·ӨЖЎӨПГӨОО®ӨмӨИӨ«ӨЙӨіӨЗІҝӨтПГӨ№Ө«ӨтА°НэӨ№ӨлЙ¬НЧАӯӨтҙ¶ӨёӨҝЎҘ
ё¶№ЖӨОМЬ°ВӨП300-350Кё»ъ/К¬ӨЗЎӨИҜЙҪ»юҙЦӨП15К¬(+јБөҝұюЕъ4К¬30ЙГ)ӨКӨОӨЗЎӨНС°ХӨ№Өлё¶№ЖӨП4500-5250Кё»ъДшЕЩЎҘ
»І№НЎ§іШІсИҜЙҪӨЗӨОПГӨ·Кэ (TAKENAKA's Web Page)
Referrer (Inside):
[2008-09-25-2]
2008-09-18
Ҙ№ҘҝҘӨҘлҘХҘЎҘӨҘлӨОА°Нэ[diary]
ИҜЙҪӨООэҪ¬ӨПҫҜӨ·ӨӘӨӨӨИӨӨӨЖЎӨіШІсӨОЕк№ЖНСӨОTeXӨОҪсј°ӨтА°Нэ([2008-09-09])ЎҘОПө»ӨЗӨдӨГӨЖӨӨӨлӨОӨЗЎӨұшӨӨҘіЎјҘЙӨАЎҘӨҪӨмӨЗӨвА°НэӨ·ӨЖӨӘӨ«ӨКӨӨӨиӨкӨПӨЮӨ·ӨАӨнӨҰЎҘәо¶ИӨО№аМЬҝфӨПИҫК¬Ө°ӨйӨӨӨ¬1ЖьӨЗҪӘӨпӨГӨҝӨОӨЗЎӨӨўӨИ1ЖьӨҜӨйӨӨӨЗҪӘӨпӨйӨ»ӨҝӨӨЎҘ
Referrer (Inside):
[2008-09-20-1]
2008-09-19
№ФИЦ№жӨОМөёъІҪ[tex]
linenoҘСҘГҘұЎјҘёӨт»ИӨГӨЖЎӨ№ФИЦ№жӨтЙҪјЁӨөӨ»ӨлКэЛЎӨПГОӨГӨЖӨӨӨҝЎҘӨ·Ө«Ө·ЎӨ°мГ¶№ФИЦ№жӨтЙҪјЁӨөӨ»ӨлӨиӨҰӨЛМҝОбӨ·ӨҝёеӨЗЎӨөХӨЛ№ФИЦ№жӨтЙҪјЁӨөӨ»ӨКӨӨКэЛЎӨПГОӨйӨКӨ«ӨГӨҝЎҘTex tipsӨтё«ӨЖЎӨ\nolinenumbersӨт»ИӨЁӨРОЙӨӨӨйӨ·ӨӨӨИӨӨӨҰӨОӨ¬ӨпӨ«ӨГӨҝЎҘӨіӨОҘЪЎјҘёӨЛӨПӨҪӨОВҫӨОҫ®ө»Ө¬ӨҝӨҜӨөӨуәЬӨГӨЖӨӨӨлЎҘ
\usepackage[pagewise]{lineno} %
\linenumbers % №ФИЦ№жӨтЙҪјЁӨөӨ»Өл
\nolinenumbers % №ФИЦ№жӨтЙҪјЁӨөӨ»ӨКӨӨ
2008-09-20
А°Нэәо¶ИВи1ГЖҙ°О»[diary]
[2008-09-18]ӨЛВіӨӨӨЖәо¶ИӨтӨ·ӨҝЎҘЖьЙХӨ¬КСӨпӨГӨЖӨ№Ө°ӨЛҙ°О»Ө·ӨҝӨОӨЗЎӨӨЫӨЬНҪДкӨЙӨӘӨкЎҘӨіӨмӨЗЎӨӨАӨӨӨЦ»ИӨӨӨдӨ№ӨҜӨКӨГӨҝӨПӨәЎҘ№»Аөөӯ№жӨКӨЙӨвА°НэӨ·ӨЖЎӨәЗҪӘё¶№ЖДуҪР»юӨЛӨӨӨБӨӨӨБ»ШДкӨ·ӨКӨҜӨЖӨвӨиӨҜӨКӨГӨҝ(ӨПӨә)ЎҘ
Referrer (Inside):
[2009-02-12-2]
2008-09-22
А°Нэәо¶ИВи2ГЖ[diary]
¶ИАУӨОА°НэӨтӨ·ӨҝЎҘӨЮӨәЎӨЛәӨмӨЖӨӨӨҝӨвӨОӨтј«ёКҫТІрӨОҘЪЎјҘёӨЛДЙІГӨ·ӨҝЎҘјЎӨЛЎӨИҜЙҪ»сОБӨКӨЙӨтPDFҘХҘЎҘӨҘлІҪӨ·ӨЖӨӨӨКӨӨӨвӨОӨ¬ӨҝӨҜӨөӨуӨўӨГӨҝӨОӨЗPDFІҪӨ·ӨҝЎҘЕЕ»ТҘХҘЎҘӨҘлӨ¬ӨўӨлӨвӨОӨПЎӨЕЕ»ТҘХҘЎҘӨҘлӨ«ӨйДҫАЬPDFӨЛКСҙ№ЎҘЕЕ»ТҘХҘЎҘӨҘлӨ¬ӨКӨӨӨвӨОӨПЎӨ°хәюКӘӨтҘ№ҘӯҘгҘК(ScanSnap
ӨИӨіӨнӨЗЎӨScanSnapӨПScanSnapS300
Referrer (Inside):
[2009-02-12-2] [2009-01-22-1] [2009-01-12-3] [2008-09-26-1]
2008-09-23
әЗДгөӨІ№[diary]
ӨіӨіӨОӨИӨіӨнӨЛӨКӨГӨЖЎӨӨиӨҰӨдӨҜәЗДгөӨІ№Ө¬20ЕЩӨтІјІуӨлӨиӨҰӨЛӨКӨГӨЖӨӯӨҝ(өӨҫЭҘЗЎјҘҝ)ЎҘӨҪӨмӨЮӨЗӨПБлӨті«ӨұӨЖҝІӨЖӨӨӨҝЎҘӨ·Ө«Ө·ЎӨ20ЕЩӨтІјІуӨлӨиӨҰӨЛӨКӨГӨЖӨ«ӨйӨПҙЁӨ№Ө®ӨлЎҘ
2008-09-24
ПўИЦӨОҘХҘЎҘӨҘлМҫӨЛКС№№Ө№Өл[dos]
¶ИАУӨдКёёҘӨОА°НэӨтӨ№ӨлӨЛӨўӨҝӨГӨЖЎӨӨўӨлЖГДкӨОҘХҘ©ҘлҘАӨЛӨўӨлҘХҘЎҘӨҘлМҫӨтПўИЦӨЛКС№№Ө№ӨлЙ¬НЧӨ¬ӨўӨГӨҝЎҘјкәо¶ИӨЗӨвӨЗӨӯӨлИП°ПӨЗӨПӨўӨлӨвӨОӨОЎӨҫӯНиӨвЖұӨёӨиӨҰӨКјкәо¶ИӨтӨҝӨҜӨөӨуӨ№ӨлІДЗҪАӯӨ¬ӨўӨлЎҘӨҪӨіӨЗЎӨ°КІјӨОҘЪЎјҘёӨт»І№НӨЛӨ·ӨДӨДЎӨј«Ж°ІҪӨ№ӨлҘРҘГҘБҘХҘЎҘӨҘлӨтәоА®Ө·ӨҝЎҘ
2008-09-25
ИҜЙҪё¶№Ж[2008ҝўАёіШІс]
ё¶№ЖӨтҪсӨӨӨҝЎҘӨАӨӨӨҝӨӨ4600Кё»ъЎҘҘ№ҘйҘӨҘЙӨОЛзҝфӨ«ӨйӨ·ӨЖӨҪӨмӨ°ӨйӨӨӨЛӨКӨлӨАӨнӨҰӨИ»ЧӨГӨЖӨӨӨҝӨОӨАӨ¬ЎӨЖГӨЛӨПДҙА°ӨПӨ»ӨәӨЛЎӨӨАӨӨӨҝӨӨМЬЙё([2008-09-17])ӨЙӨӘӨкӨОКё»ъҝфӨЛӨКӨГӨЖӨиӨ«ӨГӨҝЎҘКёҫПӨЛӨ№ӨлӨИЎӨёАӨҰӨЩӨӯӨіӨИӨИёАӨпӨКӨҜӨЖӨвӨӨӨӨӨіӨИӨтИжіУЕӘөТҙСЕӘӨЛИҪГЗӨЗӨӯӨл(ӨИ»ЧӨГӨЖӨӨӨлӨОӨАӨ¬ЎӨјВӨПӨЮӨАӨЮӨАӨАӨнӨҰ)ЎҘӨўӨИӨПӨіӨмӨЗӨвӨҙӨвӨҙӨИОэҪ¬ӨтӨ·ӨДӨДЎӨЕкұЖ»сОБӨОИщДҙА°ӨтӨ·ӨЖӨӨӨіӨҰЎҘ
Biological Conservation 141 10[article]
The contribution of roadside grassland restorations to native bee conservation
2008-09-26
Дҙәә»сОБӨОЖюОП[diary]
9·оӨЛјэҪёӨ·ӨҝДҙәәЙјӨОЖюОПәо¶ИӨтӨ·ӨҝЎҘ1ІХҪкӨЗӨПӨҪӨмӨЫӨЙ»юҙЦӨ¬Ө«Ө«ӨлӨпӨұӨЗӨПӨКӨӨЎҘӨҝӨАЎӨ60ГПЕАӨвӨўӨлӨОӨЗЎӨӨҪӨмӨКӨкӨЛ»юҙЦӨ¬Ө«Ө«ӨлЎҘӨДӨӨӨЗӨЛЎӨІбөоӨОДҙәә»сОБӨвА°НэӨЗӨӯӨмӨРОЙӨӨӨОӨПК¬Ө«ӨГӨЖӨӨӨл([2008-09-09])ЎҘӨ·Ө«Ө·ЎӨӨҪӨіӨЮӨЗӨОНҫНөӨПМөӨӨЎҘҫҜӨКӨҜӨИӨвЎӨёеӨЗәӨӨйӨКӨӨӨиӨҰӨЛЎӨәЈІуӨАӨұӨОК¬ӨПӨ·ӨГӨ«ӨкЖюОПӨ№ӨЩӨӯҫрКуӨтЖюОПӨ·ӨЖӨӨӨлЎҘӨҪӨО°мҙДӨИӨ·ӨЖЎӨ¶ИАУӨдКёёҘӨИЖұӨёӨиӨҰӨЛҘ№ҘӯҘгҘКӨЗЖЙӨЯ№юӨуӨЗPDFӨЛӨ·ӨЖӨӨӨл([2008-09-22])ЎҘӨіӨмӨЗЎӨЛьӨ¬°мДҙәәЙјӨОё¶ЙјӨ¬ё«ЕцӨҝӨйӨКӨҜӨЖӨвЎӨPDFҘХҘЎҘӨҘлӨ¬ӨўӨлӨОӨЗЎӨ°мұю°ВҝҙӨАЎҘ
2008-09-27
ІЦКҙҫЙ[diary]
Ҫ©ӨОІЦКҙҫЙӨ¬ӨПӨёӨЮӨГӨҝЎҘДҙәәӨЛ№ФӨГӨҝӨйІЦӨ¬ӨаӨәӨаӨәӨ·ӨЖӨӯӨҝЎҘөўӨкЖ»ӨОЖ»ГјӨЗӨПҘиҘвҘ®Ө¬әйӨӯ»ПӨбӨЖӨӨӨҝЎҘөоЗҜӨв°мәтЗҜӨвЎӨӨЫӨЬЖұӨё»юҙьӨЛІЦКҙҫЙӨтИҜҫЙӨ·ӨЖӨӨӨл([2006-09-27][2007-09-29])ЎҘ
2008-09-29
Plant Ecology 199 1[article]
2008-09-30
Referrer (Inside):
[2009-01-19-2] [2008-10-13-1]
2009 : 01 02 03 04 05 06 07 08 09 10 11 12
2008 : 01 02 03 04 05 06 07 08 09 10 11 12
2007 : 01 02 03 04 05 06 07 08 09 10 11 12
2006 : 01 02 03 04 05 06 07 08 09 10 11 12
әЗҪӘ№№ҝ·»юҙЦ: 2009-12-01 22:42